

Introduction
This is the last article in the series regarding “Horizontal Autoscaling” in Kubernetes. I began with an introduction to the topic and showed why autoscaling is important and how to get started with Kubernetes standard tools. In the second part I talked about how to use custom metrics in combination with the Horizontal Pod Autoscaler to be able to scale your deployments based on “non-standard” metrics (coming from e.g. Prometheus).
This article now concludes the topic. I would like to show you how to use KEDA (Kubernetes Event-Driven Autoscaler) for horizontal scaling and how this can simplify your life dramatically.
KEDA
KEDA, as the official documentation states, is a Kubernetes-based event-driven autoscaler. The project was originally initiated by Microsoft and has been developed under open source from the beginning. Since the first release, it has been widely adopted by the community and many other vendors such as Amazon, Google etc. have contributed source code / scalers to the project.
It is safe to say that the project is “ready for production” and there is no need to fear that it will disappear in the coming years.
KEDA, under the hood, works like the many other projects in this area and – first and foremost – acts as a “Custom Metrics API” for exposing metrics to the Horizontal Pod Autoscaler. Additionally, there is a “KEDA agent” that is responsible for managing / activating deployments and scale your workload between “0” and “n” replicas (scaling to zero pods is currently not possible “out-of-the-box” with the standard Horizontal Pod Autoscaler – but there is an alpha feature for it).
So in a nutshell, KEDA takes away the (sometimes huge) pain of setting up such a solution. As seen in the last article, the usage of custom metrics can generate a lot of effort upfront. KEDA is much more “lightweight” and setting it up is just a piece of cake.
This is how KEDA looks under the hood:
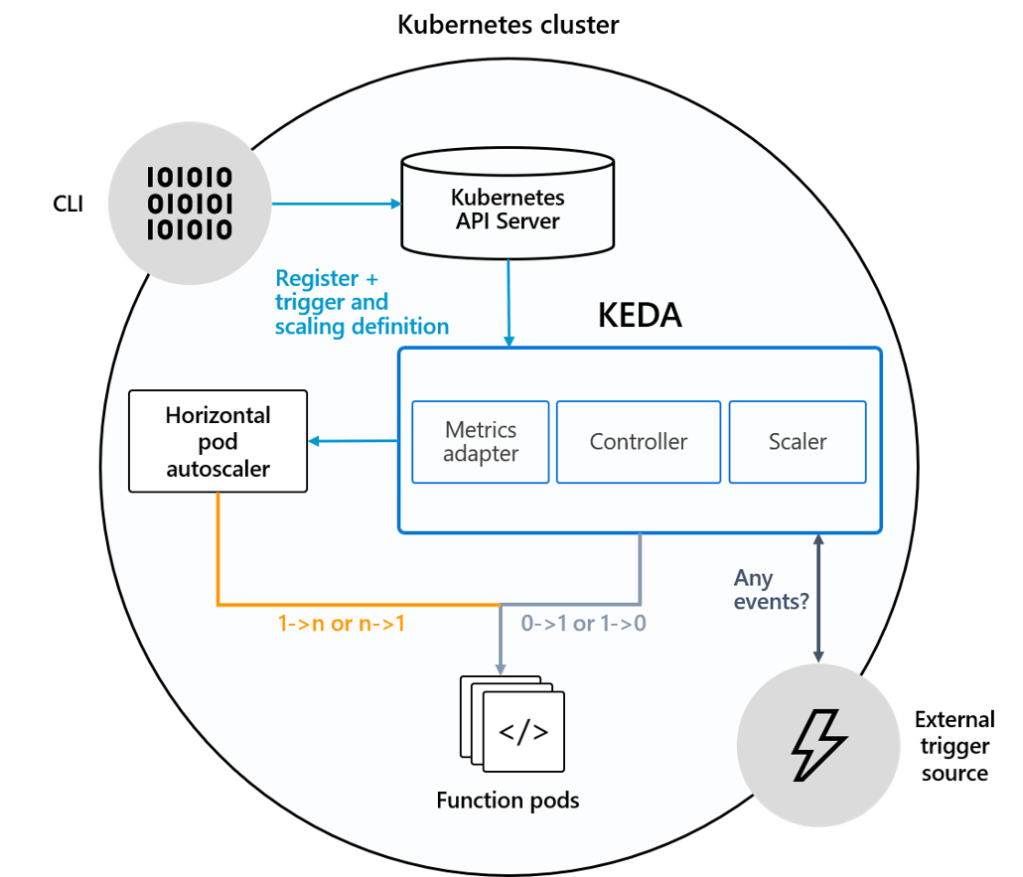
KEDA comes with its own custom resource definition, the ScaledObject which takes care of managing the “connection” between the source of the metric, access to the metric, your deployment and how scaling should work for it (min/max range of pods, threshold etc.).
The ScaledObject spec looks like that:
apiVersion: keda.k8s.io/v1alpha1
kind: ScaledObject
metadata:
  name: {scaled-object-name}
spec:
  scaleTargetRef:
    deploymentName: {deployment-name} # must be in the same namespace as the ScaledObject
    containerName: {container-name}  #Optional. Default: deployment.spec.template.spec.containers[0]
  pollingInterval: 30  # Optional. Default: 30 seconds
  cooldownPeriod:  300 # Optional. Default: 300 seconds
  minReplicaCount: 0   # Optional. Default: 0
  maxReplicaCount: 100 # Optional. Default: 100
  triggers:
  # {list of triggers to activate the deployment}
The only thing missing now is the last component of KEDA: Scalers. Scalers are adapters that provide metrics from various sources. Among others, there are scalers for:
- Kafka
- Prometheus
- AWS SQS Queue
- AWS Kinesis Stream
- GCP Pub/Sub
- Azure Blob Storage
- Azure EventHubs
- Azure ServiceBus
- Azure Monitor
- NATS
- MySQL
- etc.
A complete list of supported adapters can be found here: https://keda.sh/docs/1.4/scalers/.
As we will see later in the article, setting up such a scaler couldn’t be easier. So now, let’s get our hands dirty.
Sample
Install KEDA
To install KEDA on a Kubernetes cluster, we use Helm.
$ helm repo add kedacore https://kedacore.github.io/charts
$ helm repo update
$ kubectl create namespace keda
$ helm install keda kedacore/keda --namespace keda
BTW, if you use Helm 3, you will probably receive errors/warnings regarding a hook called “crd-install”. You can simply ignore them, see https://github.com/kedacore/charts/issues/18.
The Sample Application
To show you how KEDA works, I will simply reuse the sample application from the previous blog post. If you missed it, here’s a brief summary of what it’s like:
- a simple NodeJS / Express application
- using Prometheus client to expose the /metrics endpoint and to create/add a custom (gauge) metric called custom_metric_counter_total_by_pod
- the metric can be set from outside via /api/count endpoint
- Kubernetes service is of type LoadBalancer to receive a public IP for it
Here’s the sourcecode for the application:
const express = require("express");
const os = require("os");
const app = express();
const apiMetrics = require("prometheus-api-metrics");
app.use(apiMetrics());
app.use(express.json());

const client = require("prom-client");

// Create Prometheus Gauge metric
const gauge = new client.Gauge({
  name: "custom_metric_counter_total_by_pod",
  help: "Custom metric: Count per Pod",
  labelNames: ["pod"],
});

app.post("/api/count", (req, res) => {
  // Set metric to count value...and label to "pod name" (hostname)
  gauge.set({ pod: os.hostname }, req.body.count);
  res.status(200).send("Counter at: " + req.body.count);
});

app.listen(4000, () => {
  console.log("Server is running on port 4000");
  // initialize gauge
  gauge.set({ pod: os.hostname }, 1);
});
And here’s the deployment manifest for the application and the Kubernetes service:
apiVersion: apps/v1
kind: Deployment
metadata:
  name: promdemo
  labels:
    application: promtest
    service: api
spec:
  replicas: 2
  strategy:
    type: RollingUpdate
    rollingUpdate:
      maxSurge: 1
      maxUnavailable: 1
  minReadySeconds: 5
  revisionHistoryLimit: 3
  selector:
    matchLabels:
      application: promtest
      service: api
  template:
    metadata:
      labels:
        application: promtest
        service: api
    spec:
      automountServiceAccountToken: false
      containers:
        - name: application
          resources:
            requests:
              memory: "64Mi"
              cpu: "100m"
            limits:
              memory: "256Mi"
              cpu: "500m"
          image: csaocpger/expressmonitoring:4.3
          imagePullPolicy: IfNotPresent
          ports:
          - containerPort: 4000
---
apiVersion: v1
kind: Service
metadata:
  name: promdemo
  labels:
    application: promtest
spec:
  ports:
  - name: http
    port: 4000
    targetPort: 4000
  selector:
    application: promtest
    service: api
  type: LoadBalancer
Collect Custom Metrics with Prometheus
In order to have a “metrics collector” that we can use in combination with KEDA, we need to install Prometheus. Due to the kube-prometheus project, this is not much of a problem. Go to https://github.com/coreos/kube-prometheus, clone it to your local machine and install Prometheus, Grafana etc. via:
$ kubectl apply -f manifests/setup
$ kubectl apply -f manifests/
After the installation has finished, we also need to tell Prometheus to scrape the /metrics endpoint of our application. Therefore, we need to create a ServiceMonitor which is a custom resource definition from Prometheus, pointing to “a source of metrics”. Apply the following Kubernetes manifest:
kind: ServiceMonitor
apiVersion: monitoring.coreos.com/v1
metadata:
  name: promtest
  labels:
    application: promtest
spec:
  selector:
    matchLabels:
      application: promtest
  endpoints:
  - port: http
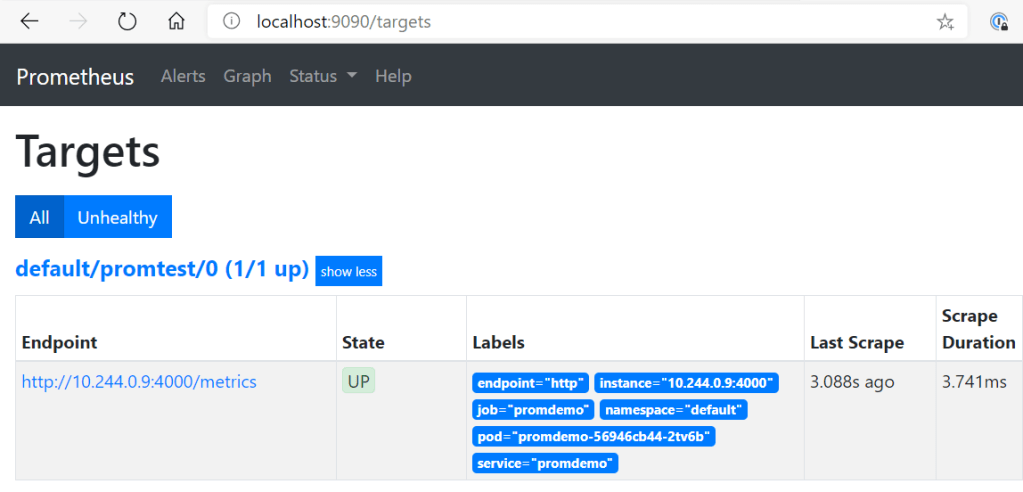
So now, let’s check, if everything is in place regarding the monitoring of the application. This can easily be achieved by having a look at the Prometheus targets:
$ kubectl --namespace monitoring port-forward svc/prometheus-k8s 9090
Forwarding from 127.0.0.1:9090 -> 9090
Forwarding from [::1]:9090 -> 9090
Open your local browser at http://localhost:9090/targets.
This looks good. Now, we can also check Grafana. Therefor, also “port-forward” the Grafana service to your local machine (kubectl --namespace monitoring port-forward svc/grafana 3000) and open the browser at http://localhost:3000 (the definition of the dashboard you see here is available in the GitHub repo mentioned at the end of the blog post).
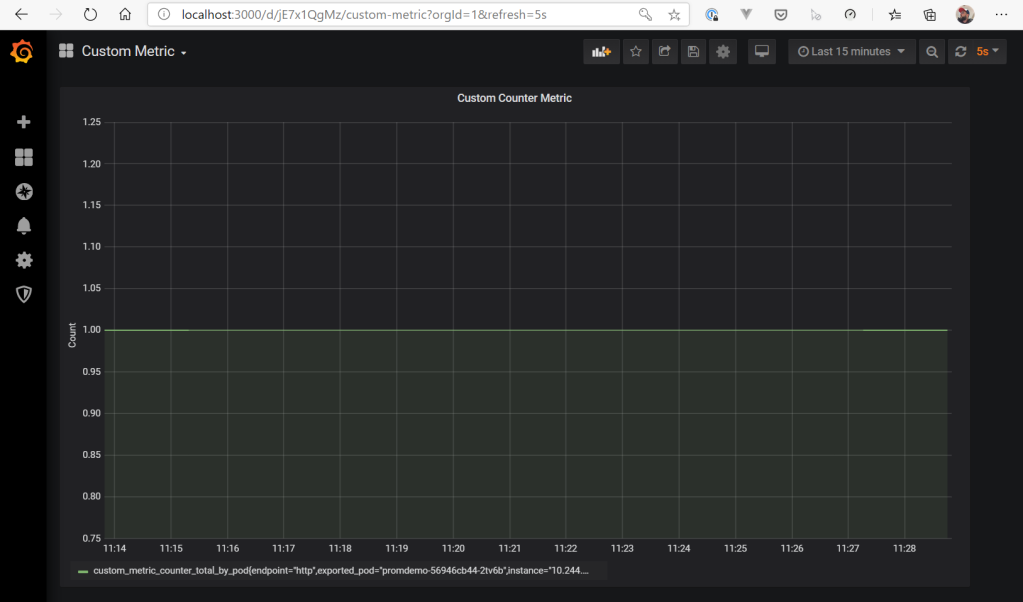
As we can see here, the application reports a current value of “1” for the custom metric (custom_metric_counter_total_by_pod).
ScaledObject Definition
So, the last missing piece to be able to scale the application with KEDA is the ScaledObject definition. As mentioned before, this is the connection between the Kubernetes deployment, the metrics source/collector and the Kubernetes HorizontalPodAutoscaler.
For the current sample, the definition looks like this:
apiVersion: keda.k8s.io/v1alpha1
kind: ScaledObject
metadata:
  name: prometheus-scaledobject
  namespace: default
spec:
  scaleTargetRef:
    deploymentName: promdemo
  triggers:
  - type: prometheus
    metadata:
      serverAddress: http://prometheus-k8s.monitoring.svc:9090
      metricName: custom_metric_counter_total_by_pod
      threshold: '3'
      query: sum(custom_metric_counter_total_by_pod{namespace!="",pod!=""})
Let’s just walk through the spec part of the definition…we tell KEDA the target we want to scale, in this case, the deployment (scaleTargetRef) of the application. In the triggers section, we point KEDA to our Prometheus service and specify the metric name, the query to issue to collect the current value of the metric and the threshold – the target value for the Horizontal Pod Autoscaler that will automatically be created and managed by KEDA.
And how does that HPA look like? Here is the current version of it as a result of the applied ScaledObject definition from above.
apiVersion: v1
items:
- apiVersion: autoscaling/v1
  kind: HorizontalPodAutoscaler
  metadata:
    annotations:
      autoscaling.alpha.kubernetes.io/conditions: '[{"type":"AbleToScale","status":"True","lastTransitionTime":"2020-05-20T07:02:21Z","reason":"ReadyForNewScale","message":"recommended
        size matches current size"},{"type":"ScalingActive","status":"True","lastTransitionTime":"2020-05-20T07:02:21Z","reason":"ValidMetricFound","message":"the
        HPA was able to successfully calculate a replica count from external metric
        custom_metric_counter_total_by_pod(\u0026LabelSelector{MatchLabels:map[string]string{deploymentName:
        promdemo,},MatchExpressions:[]LabelSelectorRequirement{},})"},{"type":"ScalingLimited","status":"False","lastTransitionTime":"2020-05-20T07:02:21Z","reason":"DesiredWithinRange","message":"the
        desired count is within the acceptable range"}]'
      autoscaling.alpha.kubernetes.io/current-metrics: '[{"type":"External","external":{"metricName":"custom_metric_counter_total_by_pod","metricSelector":{"matchLabels":{"deploymentName":"promdemo"}},"currentValue":"1","currentAverageValue":"1"}}]'
      autoscaling.alpha.kubernetes.io/metrics: '[{"type":"External","external":{"metricName":"custom_metric_counter_total_by_pod","metricSelector":{"matchLabels":{"deploymentName":"promdemo"}},"targetAverageValue":"3"}}]'
    creationTimestamp: "2020-05-20T07:02:05Z"
    labels:
      app.kubernetes.io/managed-by: keda-operator
      app.kubernetes.io/name: keda-hpa-promdemo
      app.kubernetes.io/part-of: prometheus-scaledobject
      app.kubernetes.io/version: 1.4.1
    name: keda-hpa-promdemo
    namespace: default
    ownerReferences:
    - apiVersion: keda.k8s.io/v1alpha1
      blockOwnerDeletion: true
      controller: true
      kind: ScaledObject
      name: prometheus-scaledobject
      uid: 3074e89f-3b3b-4c7e-a376-09ad03b5fcb3
    resourceVersion: "821883"
    selfLink: /apis/autoscaling/v1/namespaces/default/horizontalpodautoscalers/keda-hpa-promdemo
    uid: 382a20d0-8358-4042-8718-bf2bcf832a31
  spec:
    maxReplicas: 100
    minReplicas: 1
    scaleTargetRef:
      apiVersion: apps/v1
      kind: Deployment
      name: promdemo
  status:
    currentReplicas: 1
    desiredReplicas: 1
    lastScaleTime: "2020-05-25T10:26:38Z"
kind: List
metadata:
  resourceVersion: ""
  selfLink: ""
You can see, the ScaledObject properties have been added as annotations to the HPA and that it was already able to fetch the metric value from Prometheus.
Scale Application
Now, let’s see KEDA in action…
The application exposes an endpoint (/api/count) with which we can set the value of the metric in Prometheus (again, as a reminder, the value of custom_metric_counter_total_by_pod is currently set to “1”).
Now let’s set the value to “7”. With the current threshold of “3”, KEDA should scale up to at least three pods.
$ curl --location --request POST 'http://<EXTERNAL_IP_OF_SERVICE>:4000/api/count' \
--header 'Content-Type: application/json' \
--data-raw '{
	"count": 7
}'
Let’s look at the events within Kubernetes:
$ k get events
LAST SEEN   TYPE     REASON              OBJECT                                      MESSAGE
2m25s       Normal   SuccessfulRescale   horizontalpodautoscaler/keda-hpa-promdemo   New size: 3; reason: external metric custom_metric_counter_total_by_pod(&LabelSelector{MatchLabels:map[string]string{deploymentName: promdemo,},MatchExpressions:[]LabelSelectorRequirement{},}) above target
<unknown>   Normal   Scheduled           pod/promdemo-56946cb44-bn75c                Successfully assigned default/promdemo-56946cb44-bn75c to aks-nodepool1-12224416-vmss000001
2m24s       Normal   Pulled              pod/promdemo-56946cb44-bn75c                Container image "csaocpger/expressmonitoring:4.3" already present on machine
2m24s       Normal   Created             pod/promdemo-56946cb44-bn75c                Created container application
2m24s       Normal   Started             pod/promdemo-56946cb44-bn75c                Started container application
<unknown>   Normal   Scheduled           pod/promdemo-56946cb44-mztrk                Successfully assigned default/promdemo-56946cb44-mztrk to aks-nodepool1-12224416-vmss000002
2m24s       Normal   Pulled              pod/promdemo-56946cb44-mztrk                Container image "csaocpger/expressmonitoring:4.3" already present on machine
2m24s       Normal   Created             pod/promdemo-56946cb44-mztrk                Created container application
2m24s       Normal   Started             pod/promdemo-56946cb44-mztrk                Started container application
2m25s       Normal   SuccessfulCreate    replicaset/promdemo-56946cb44               Created pod: promdemo-56946cb44-bn75c
2m25s       Normal   SuccessfulCreate    replicaset/promdemo-56946cb44               Created pod: promdemo-56946cb44-mztrk
2m25s       Normal   ScalingReplicaSet   deployment/promdemo                         Scaled up replica set promdemo-56946cb44 to 3
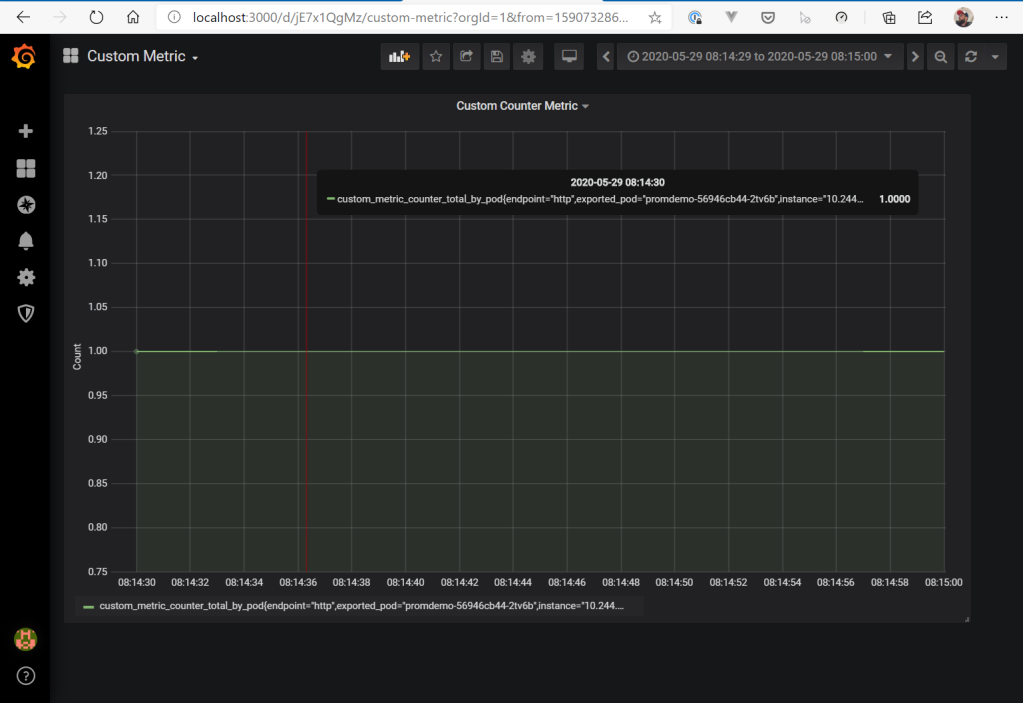
And this is how the Grafana dashboard looks like…

As you can see here, KEDA is incredibly fast in querying the metric and the corresponding scaling process (in combination with the HPA) of the target deployment. The deployment has been scaled up to three pods, based on a custom metric – all we wanted to achieve 🙂
Wrap-Up
So, this was the last article about horizontal scaling in Kubernetes. In my opinion the community has provided a powerful and simple tool with KEDA to trigger scaling processes based on external sources / custom metrics. If you compare this to the sample in the previous article, KEDA is way easier to setup! By the way, it works perfectly in combination with Azure Functions, which can be run in a Kubernetes cluster based on Docker images Microsoft provides. Cream of the crop is then to outsource such workloads on virtual nodes, so that the actual cluster is not stressed. But this is a topic for a possible future article 🙂
I hope I was able to shed some light on how horizontal scaling works and how to automatically scale your own deployments based on metrics coming from external / custom sources. If you miss something, give me a short hint 🙂
As always, you can find the source code for this article on GitHub: https://github.com/cdennig/k8s-keda
So long…
Articles in this series:

One Reply to “”